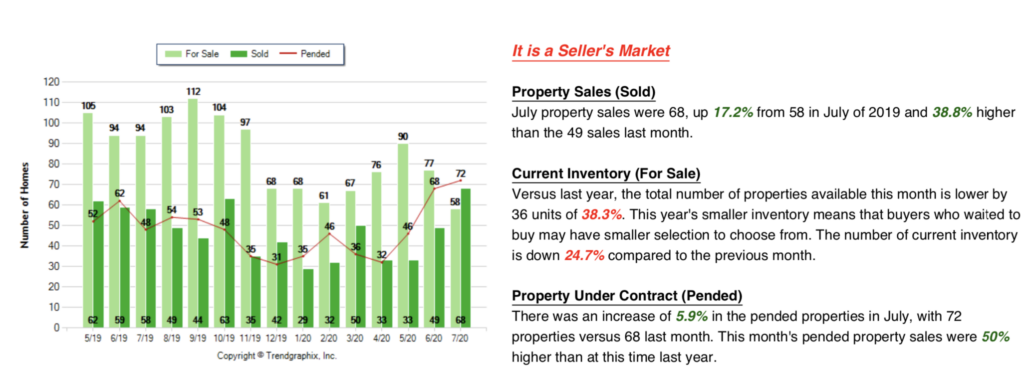
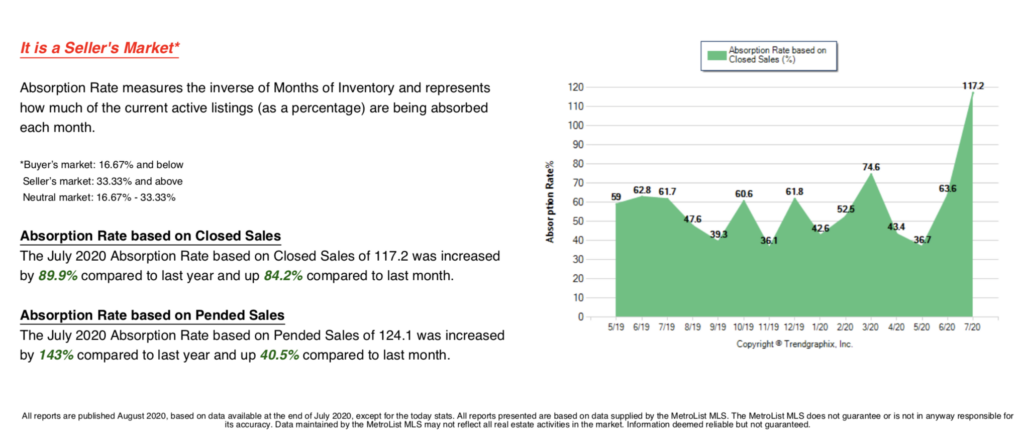
July 2020 is a Seller’s market! The number of for sale listings was down 38.3% from one year earlier and down 24.7% from the previous month. The number of sold listings increased 17.2% year over year and increased 38.8% month over month. The number of under contract listings was up 5.9% compared to previous month and up 50% compared to previous year. The Months of Inventory based on Closed Sales is 0.9, down 43.2% from the previous year.
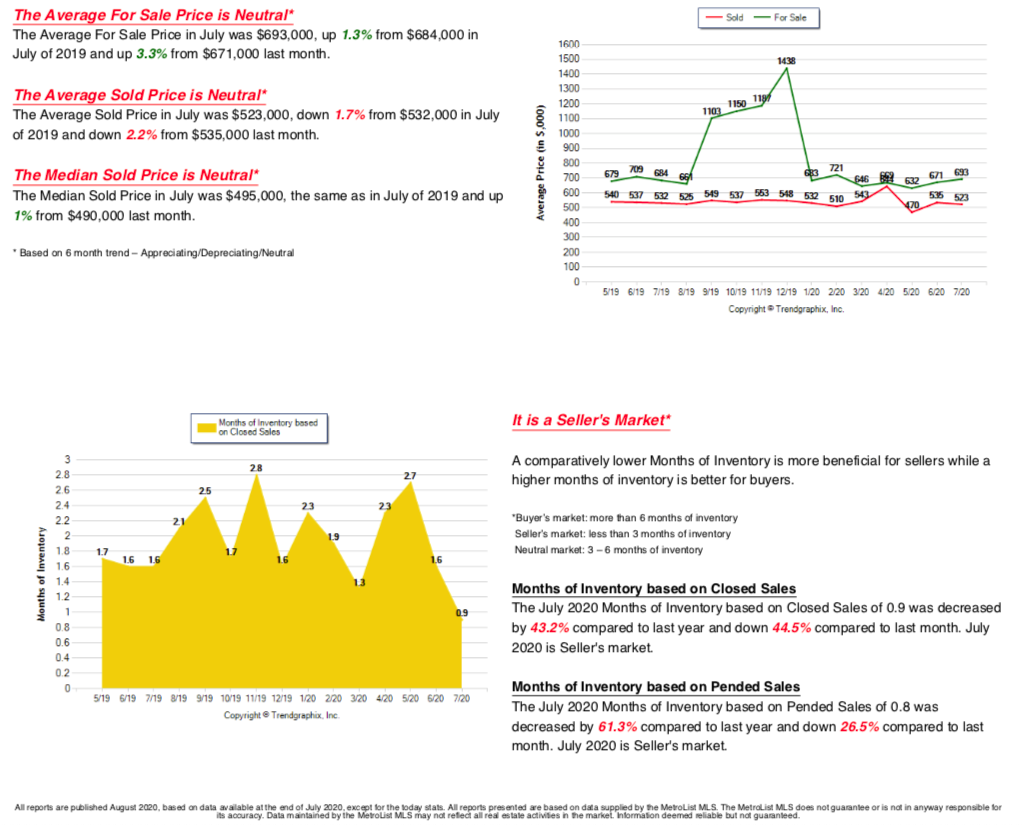
The Average Sold Price per Square Footage was up 6% compared to previous month and up 10.5% compared to last year. The Median Sold Price increased by 1% from last month. The Average Sold Price also decreased by 2.2% from last month. Based on the 6 month trend, the Average Sold Price trend is “Neutral” and the Median Sold Price trend is “Neutral”.
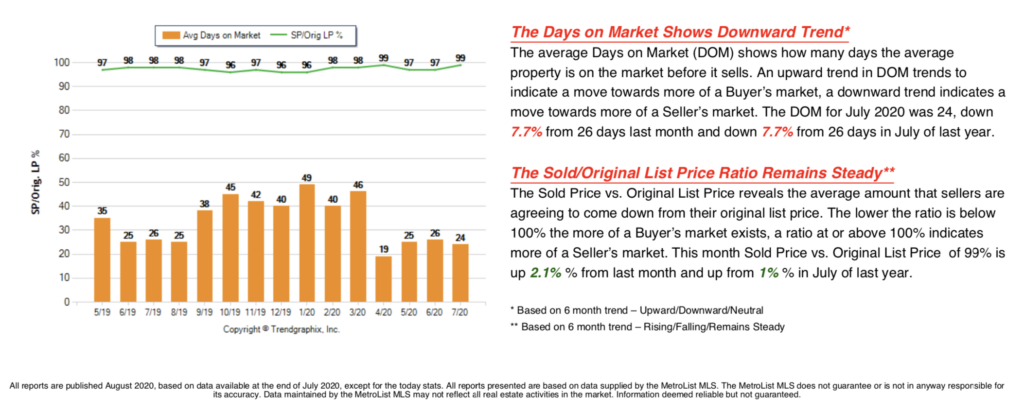
The Average Days on Market showed a downward trend, a decrease of 7.7% compared to previous year. The ratio of Sold Price vs. Original List Price is 99%, an increase of 1% compared to previous year. All the data below is based on home prices starting at $350,000 and up.


